Balanced Scorecard
The Balanced Scorecard (BSC) is a management tool that allows a company's strategy to be implemented based on a series of performance measures.
This ensures permanent control over all factors in the organization, interrelating objectives and relating them to specific actions.
1. How does it work
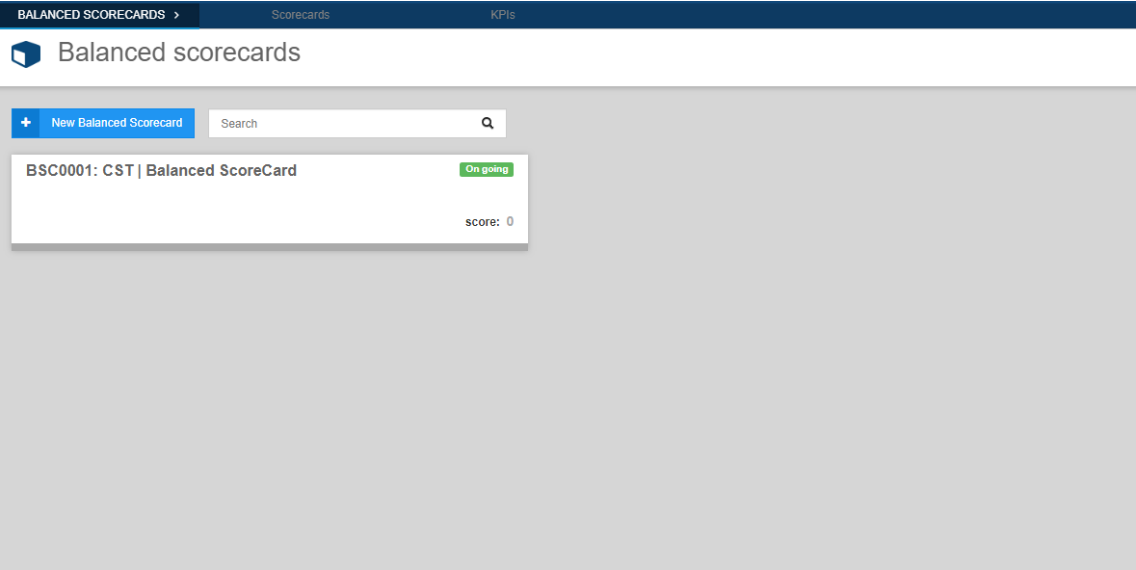
First things first: setting up the Balance Scorecards (BSC) .
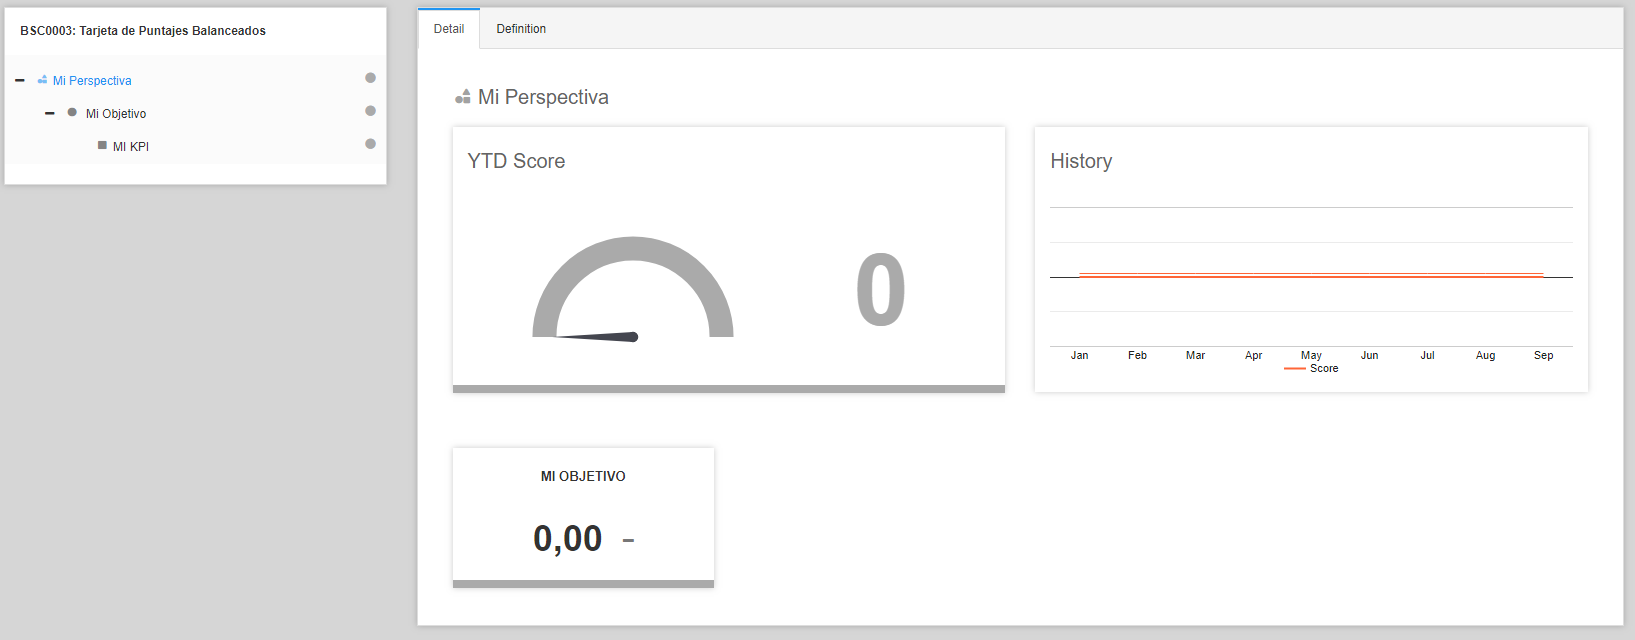
Balance Scorecards include perspectives, objectives, KPI’s and DrillDowns Each one of them depends on the other one in a Newick tree format
Every element that belongs to the module has its own traffic light indicator, historical coordinates graph and the items they inherit.
PerspectivesBSC perspectives help organize the strategic objectives and bring them together according to the elements on which a goal is set. Therefore, perspectives are areas of performance of the BSC focused on a particular area of the organization. |
Aims and ObjectivesStrategic objectives are those objectives or goals developed at a strategic level that an organization intends to achieve in the long term. These objectives are based on the vision, mission and values of the organization and determine the actions that will be executed. |
KPI's and Drill DownsKPIs are key performance indicators just like DrillDowns. The only difference between the two is that a Drill Down can feed information to a KPI. |
|
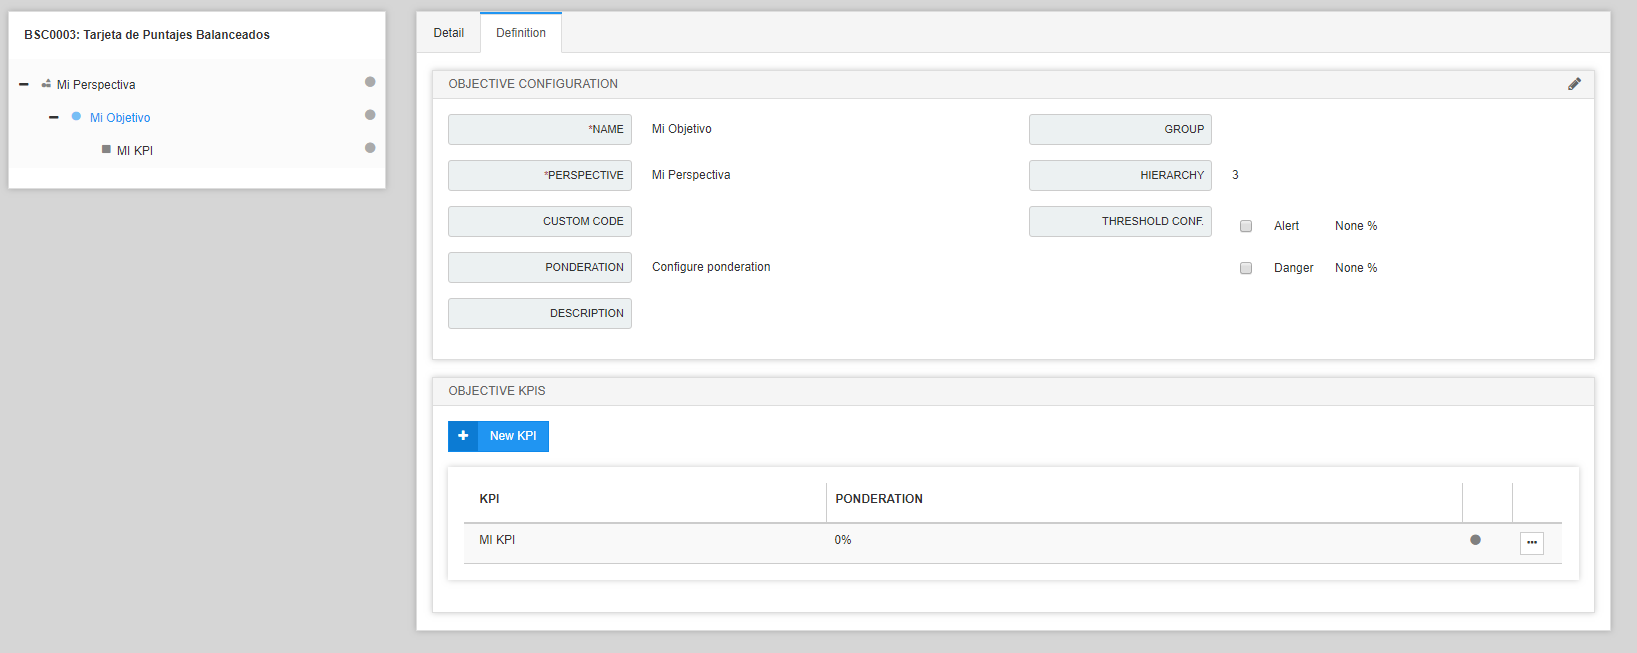
Definition of ItemsEach of the items has different setting options that are particular to each one. It is recommended to perform this action only once since changing the configuration can lead to the values to be modified.Perspective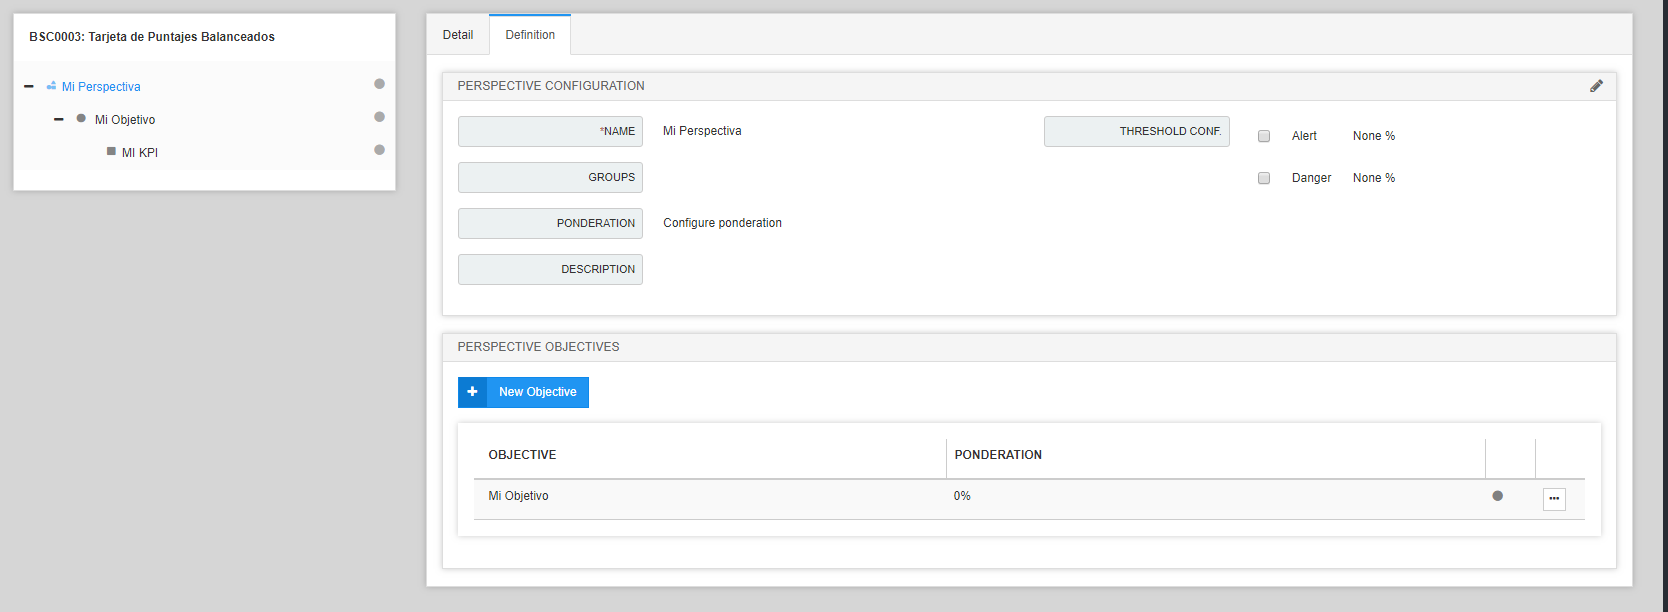
This is the first setting. Just enter the name and percentage of the caution limit for the yellow limits and danger, for the red limits.
|
2. The KPI
1.1. InformationWe use the same configuration as for the previous items, taking into account the options that are added to the definition tab.The main fields of the Information tab are explained. This allows us to start using them immediately.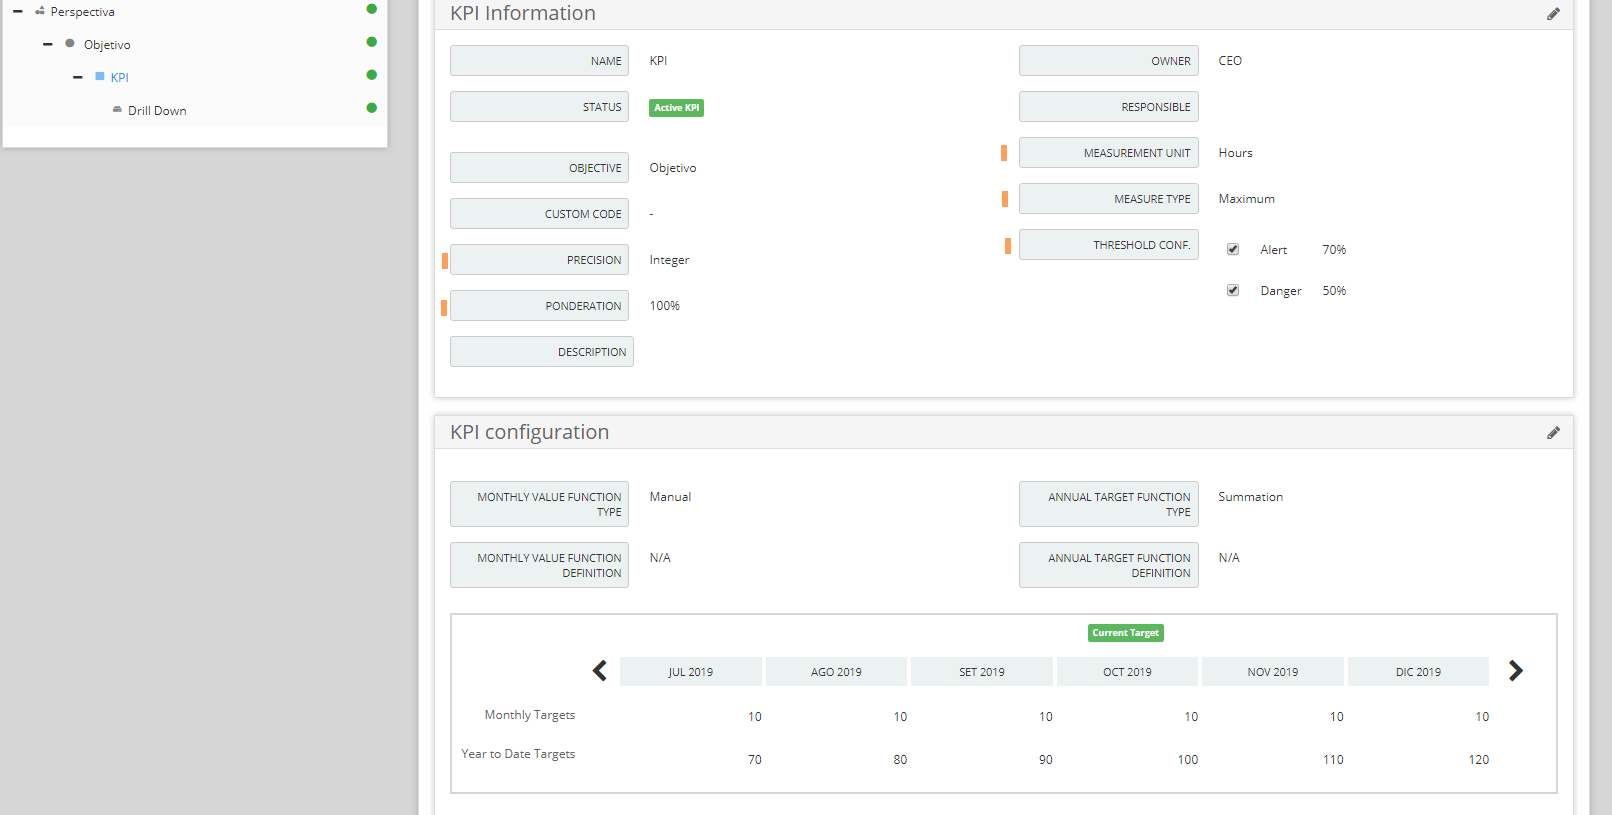
In the Precision section, we can define the number of decimal separators that the values of the KPI will have.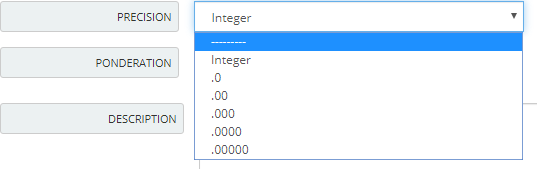
Next we’ll find the Ponderation section which will help us define the percentages that each of these KPIs will represent with respect to the objective.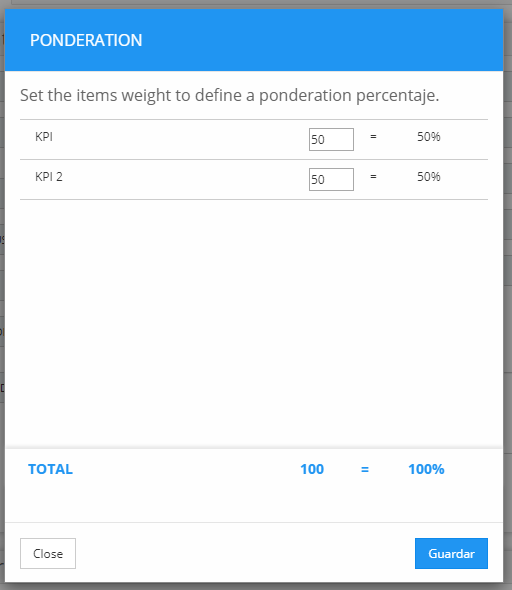
The unit of measure field will allow us to select which type of data to measure.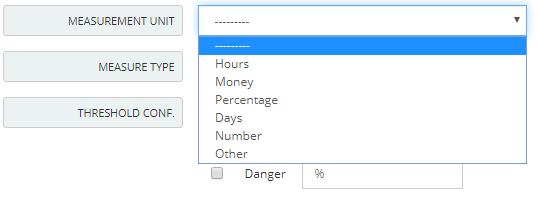
The Measure Type section will allow us to choose between maximum and minimum.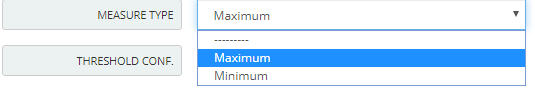
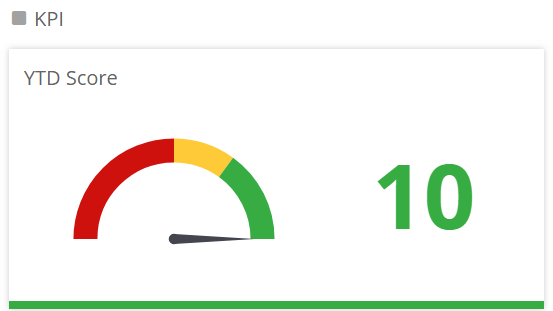
Setting the limits is important since the values that we introduce will determine how the colors will be distributed in our indicator. The color yellow means Caution and the color red means Danger.
|
1.2. Configuration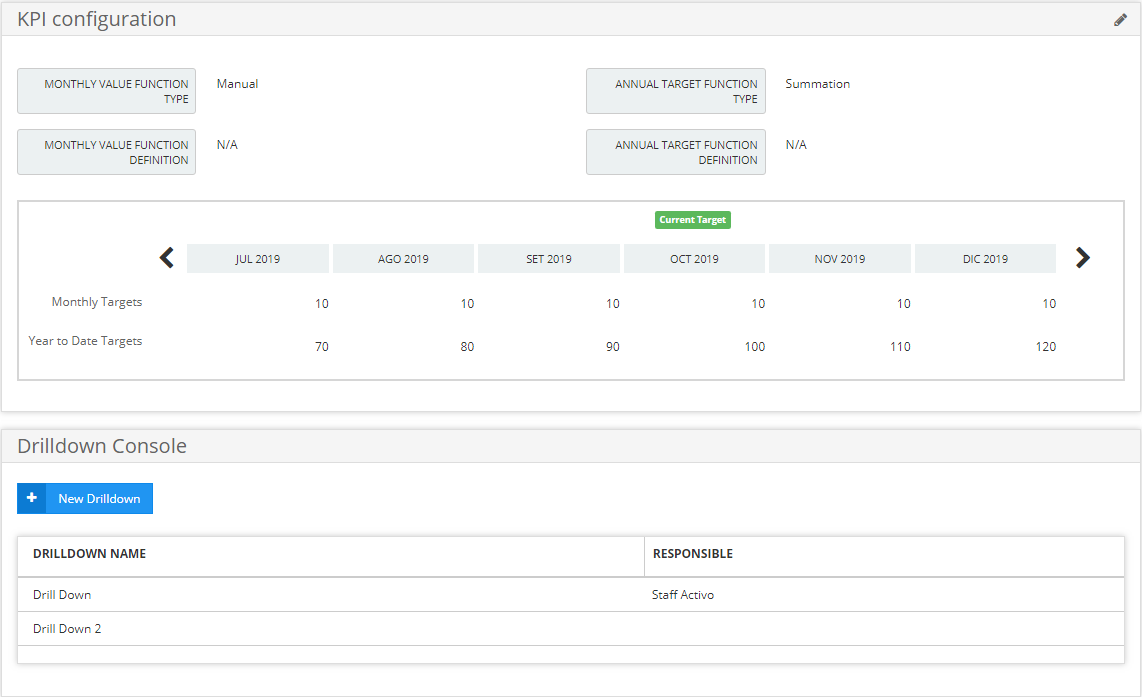
In this section, we will explain how to set the KPIs. There are two ways of doing this: both the values that are entered and the values that are expected can be set manually or automatically.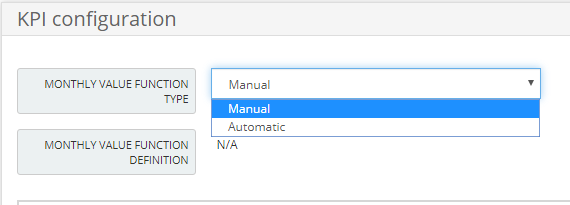
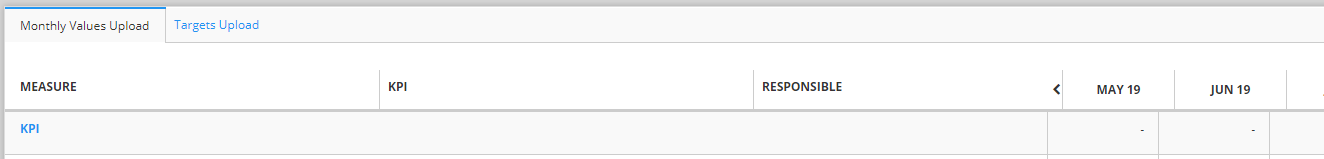
1.3. Uploading ValuesThe KPIs’ values can be uploaded on the KPI Data Upload tab.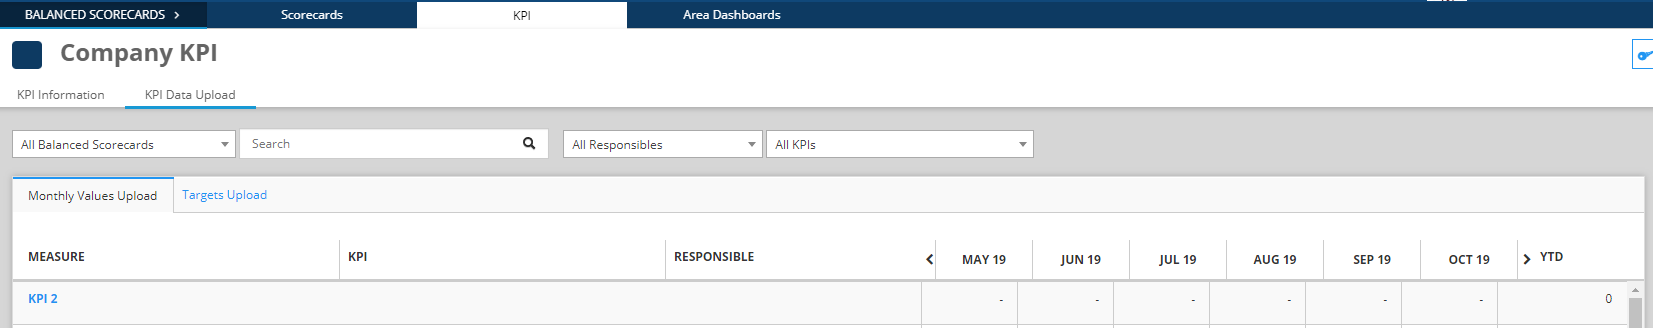
On this tab, there are two sections: Monthly Values Upload and Targets Upload
|
1.3 Automatic FunctionsBoth KPI's and Drilldowns can get values from automatic functions. In order to do this, we have to select the type of function.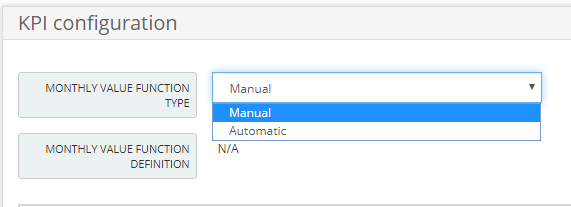
After setting the KPI in automatic, we have to set the function by clicking on set function.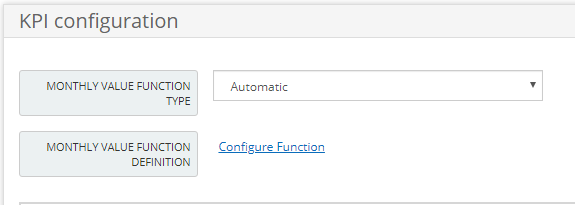
At this point, a modal will open where we will introduce the name of the function that we want to enter and which specific function we want to perform.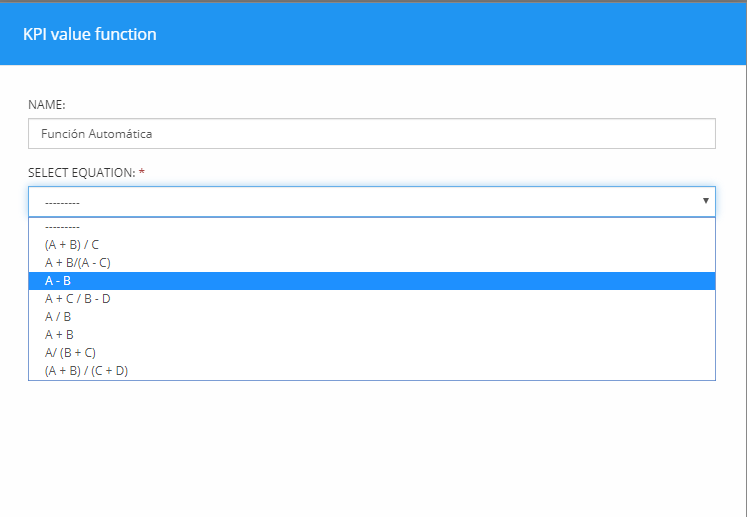
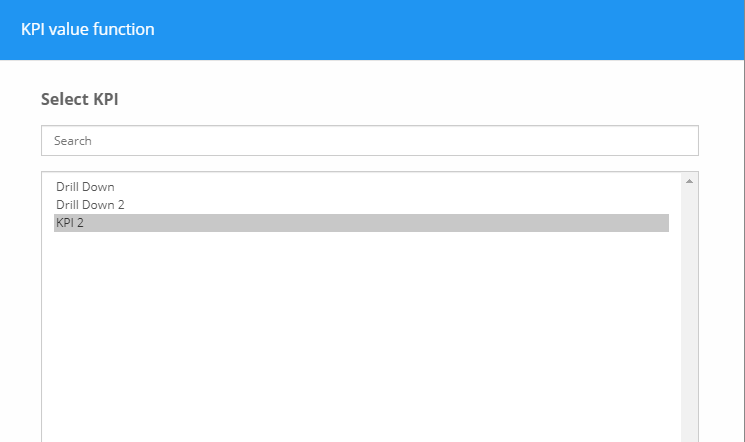
Select the variables of the terms of that function and click on save.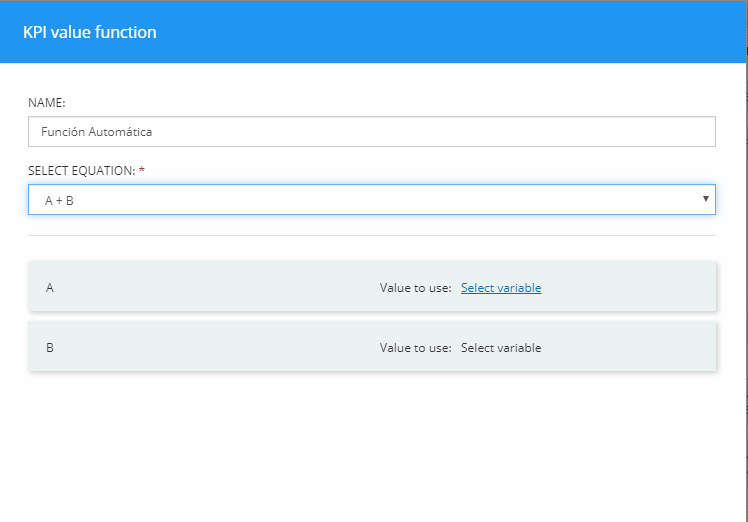
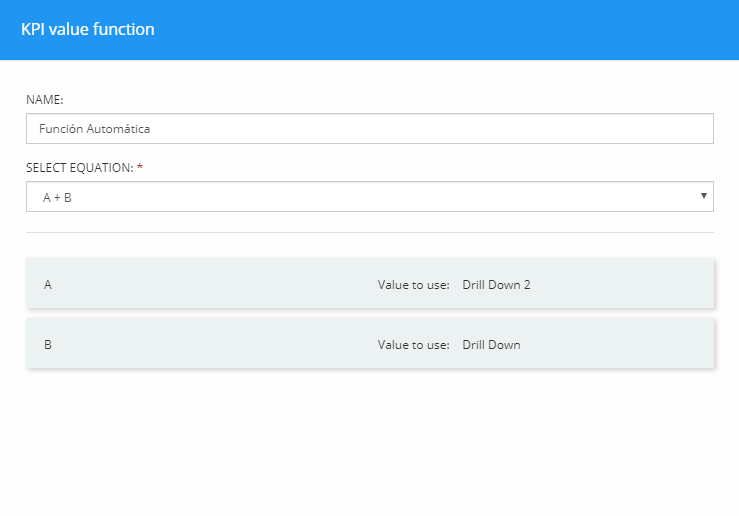
Now everything is ready and we will be able to keep track of our progress and performance. |